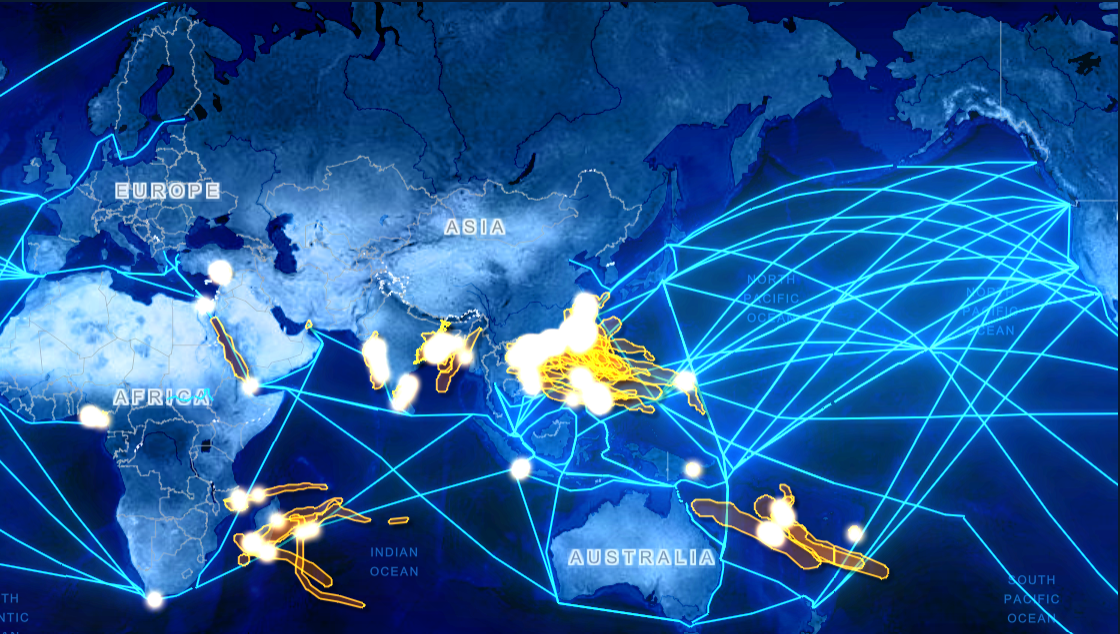
Trade Nowcast
PortWatch now offers a Trade Nowcast page with a nowcasting model of global trade, based on the IMF Working Paper "Nowcasting Global Trade from Space" (Arslanalp et al., 2025). It uses real-time satellite data, with monthly updates and weekly revisions.
Areas Affected by Current and Recent Trade Disruptions
This map visualizes the most recent disruptions (recorded since 2021) and the ports disrupted.Access the data here for the full list.
Click on a disaster icon to view it on the map or on the disruption page to view more details about the impact on port activity and potential spillovers.
Esri, Vantar, Earthstar Geographics, and the GIS User Community | Esri, TomTom, FAO, NOAA, USGS
Powered by Esri
Results updated • 16 disruptions
List item • Press TAB to continue
Global maritime trade routes visualized through satellite data